Client proof
Flagship case studyMeasured performance

Nutrition & wellness

Dr. Haley Nutrition

Twelve sharper Instagram posts earned more followers than the previous twenty three.

Change on record

From

23 Instagram posts in December

To

12 sharper posts in January

Scope

Space · ongoing content managementAir · content strategy
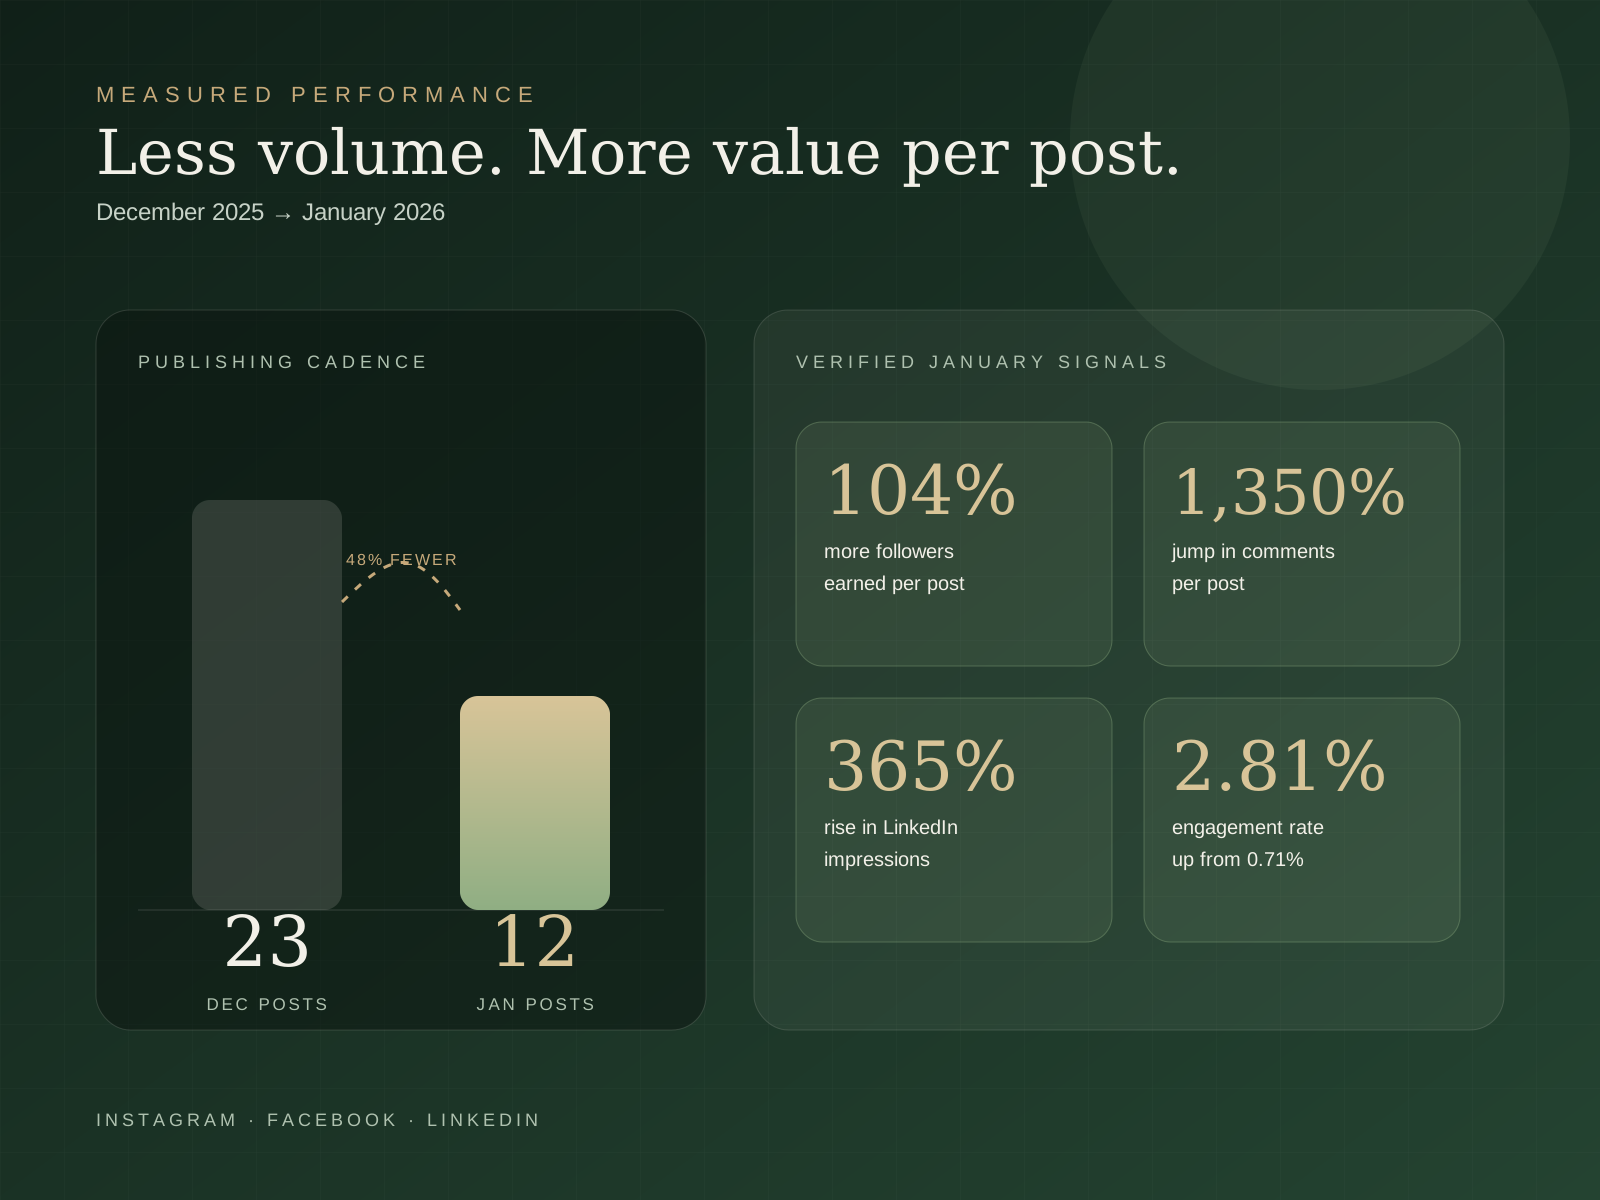
Dr. Haley Nutrition measured performance diagram showing the recorded change from 23 Instagram posts in December to 12 sharper posts in January.
Project evidenceMeasured performance
See the result first

Recorded result

Start with what the record can support.

Followers earned per post increased 104%, comments per post increased 1,350%, and LinkedIn impressions rose 365%.

104%

more followers earned per post

1,350%

jump in comments per post

365%

rise in LinkedIn impressions

2.81%

engagement rate, up from 0.71%

Decision record

What was made, and why it was made that way.

Evidence map01 / 06
Publishing volume

23 → 12

Instagram posts

Value per post

104%

more followers per post

Starting condition

The real problem beneath the requested output

A nutrition brand's social presence was growing in volume while quality lagged behind. More posts were failing to translate into an audience that would actually stay. The two month engagement, running December 2025 to January 2026, needed to prove whether fewer, sharper posts could outperform a heavier posting schedule.

What the work contained

Inspect the decisions inside the deliverable.

Dr. Haley Nutrition measured performance diagram showing the recorded change from 23 Instagram posts in December to 12 sharper posts in January.

Project evidence

Twelve sharper posts earned more followers and far more comments than twenty three.

01 · Cadence

Instagram publishing moved from 23 posts in December to 12 in January.

02 · Instagram

January earned 126 followers from 12 posts, compared with 111 from 23 posts in December.

03 · Facebook

Cadence stayed steady while engagement per post increased 67%.

04 · LinkedIn

Impressions rose 365%, while engagement rate moved from 0.71% to 2.81%.

Outcome and boundary

What can be claimed, and what cannot.

Instagram gained 126 new followers in January from 12 posts, more than December's 111 followers from 23 posts. That's a 104% increase in followers earned per post, alongside a 1,350% jump in comments per post. Facebook grew steadily from roughly 59 to 69 total fans over the same period, with engagement per post up 67%. LinkedIn impressions rose 365%, and engagement rate climbed from 0.71% to 2.81%.

The clearest signal was impressions barely dropping (down just 10%) despite posting 48% less. The platform was actively rewarding the more relevant content instead of just showing it to fewer people. That's the difference between reach and trust.

If this is your problem

Posting more, but earning less attention?

Suman can separate a volume problem from a relevance problem before you commission another content calendar.